Ivanti Neurons for ITSM and Endpoint Manager Connector
Endpoint Manager allows you to import data from your Endpoint Manager database into the Ivanti Neurons for ITSM configuration management database. This is a one-way import of data.
Prerequisites
Following are the prerequisites for importing Endpoint Manager data into Neurons for ITSM.
Roles
The applicable user role is:
•Administrator
Packages
Packages required to import the data are:
•EPMConnector.Metadatapackage
•ISM_EPM_Infrastructure_Mapping.MetadataPackage
Minimum Supported Version
•Neurons for ITSM - 2017.3 onwards
Endpoint Manager Configuration
Configure the Windows Firewall to Allow SQL Server Access
You must configure the firewall on the computer that is running SQL Server. This enables you to access the Endpoint Manager database through Neurons for ITSM application for importing Endpoint Manager Configuration Items into the Neurons for ITSM application.
Turn on the SQL Server Browser Service
To turn on the SQL Server Browser Service, follow the below steps:
1.Open Services and right-click SQL Server Browser Service and select Properties.
2.Change Start Type to Automatic and click Start.
3.Confirm that SQL Server Browser service is up and running.
Enable Remote Connections
1.To enable remote connections on the Instance of SQL Server that you want to connect to from a remote computer, follow the below steps:
2.Open the SQL Management Studio and right-click the server name on the left pane and select Properties.
3.Select Connections on the left pane and select the Allow remote connections to this server checkbox.
| a. | Configure the SQL server ports for the instance. |
| b. | Go to SQL Server Configuration Manager for a specific instance of SQL Server. |
| c. | Enable the Named Pipes protocol. |
| d. | Right click on TCP/IP protocol, you will get the TCP/IP properties. |
| e. | Go to the IP Addresses tab and here you may edit or view the port configurations for a specific instance of SQL Server (IPALL – TCP Port 1433). |
| f. | Restart the SQL server in the Services. |
Configure the Windows Firewall
To allow network traffic that is related to SQL Server and to the SQL Server Browser service, follow the below steps:
1.A port exception for TCP Port 1433. In the Windows Firewall with Advanced Security, in the left pane, right-click Inbound Rules, and then click New Rule in the Action pane.
Use the following information to create a port exception:
| a. | Select Port |
| b. | Select TCP and specify port 1433 |
| c. | Allow the connection |
| d. | Choose all three profiles (Domain, Private & Public) |
| e. | Name the rule “SQL – TCP 1433” |
| f. | Click Finish |
2.A port exception for UDP Port 1434. In the Windows Firewall with Advanced Security, in the left pane, right-click Inbound Rules, and then click New Rule in the Action pane.
Use the following information to create a port exception:
| a. | Select Port |
| b. | Select UDP and specify port 1434 |
| c. | Allow the connection |
| d. | Choose all three profiles (Domain, Private & Public) |
| e. | Name the rule “SQL – UDP 1434” |
| f. | Click Finish |
For more information see Configure the Windows Firewall to Allow SQL Server Access
Importing Packages into Neurons for ITSM
1.Log in to Neurons for ITSM as an Administrator.
2.Click the Settings icon to open the Settings page.
3.Click the Heat Development Package option on the left panel and click Packages.
4.Click the Import Package option.
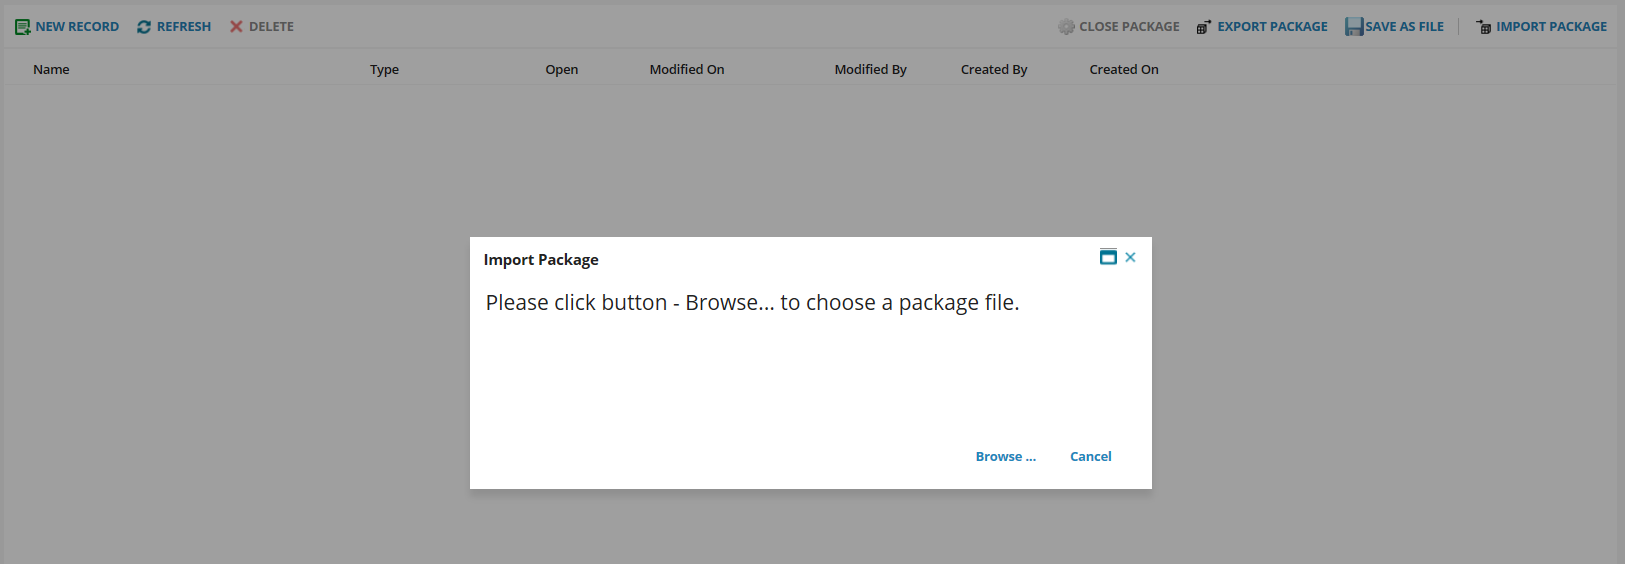

5.Click the Preview Impact button in the Import Package window.
6.Select the Validate and apply if no errors option as the default option and execute.
If import is successful, the following message will appear.
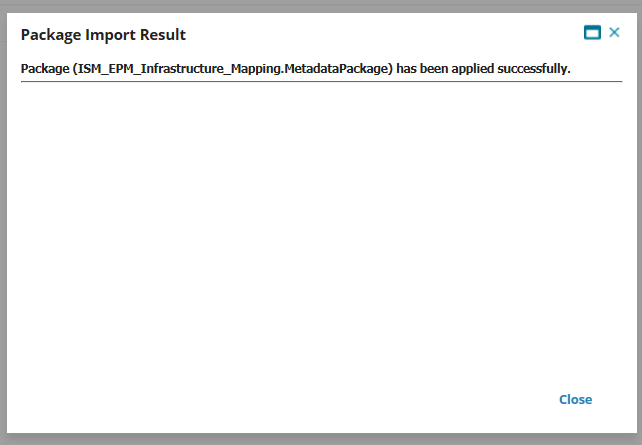
7.Close the Package Import Result dialog box to proceed.
8.Repeat the steps to import Endpoint Manager integration packages.
Data Imported by the Neurons for ITSM Database
The Ivanti Neurons for ITSM database supports mapping objects for Business Objects - Monitor, Mobile Device, Printer, Router, Switch, UPS, Video Conference, and Phone from the Endpoint Manager database. However, the application is flexible and you can define other objects as well.
Database import for the following Business Objects is supported:
•Router, Switch, UPS, Phone, and Video Conference
Importing the Endpoint Manager Configuration Items into Neurons for ITSM
The Endpoint Manager connector enables Ivanti Neurons for ITSM to import Configuration Item (CI) information from the Endpoint Manager database in any of the SQL server instances. See Setting Up a Data Import Connection.
To enable data import from Endpoint Manager database to Neurons for ITSM, we need to configure the firewall by opening the ports to allow external remote connection to the Endpoint Manager Server.
In case of any issues in connecting/reaching to the Endpoint Manager Server from Neurons for ITSM, On-Premise Endpoint Manager and Cloud Neurons for ITSM setup and infrastructure VPN tunnel must be configured for connectivity.
1.Log in to Neurons for ITSM as an Administrator and click the Settings icon to open the Settings page.
2.Click the Integration Tools > Data Import Connections.
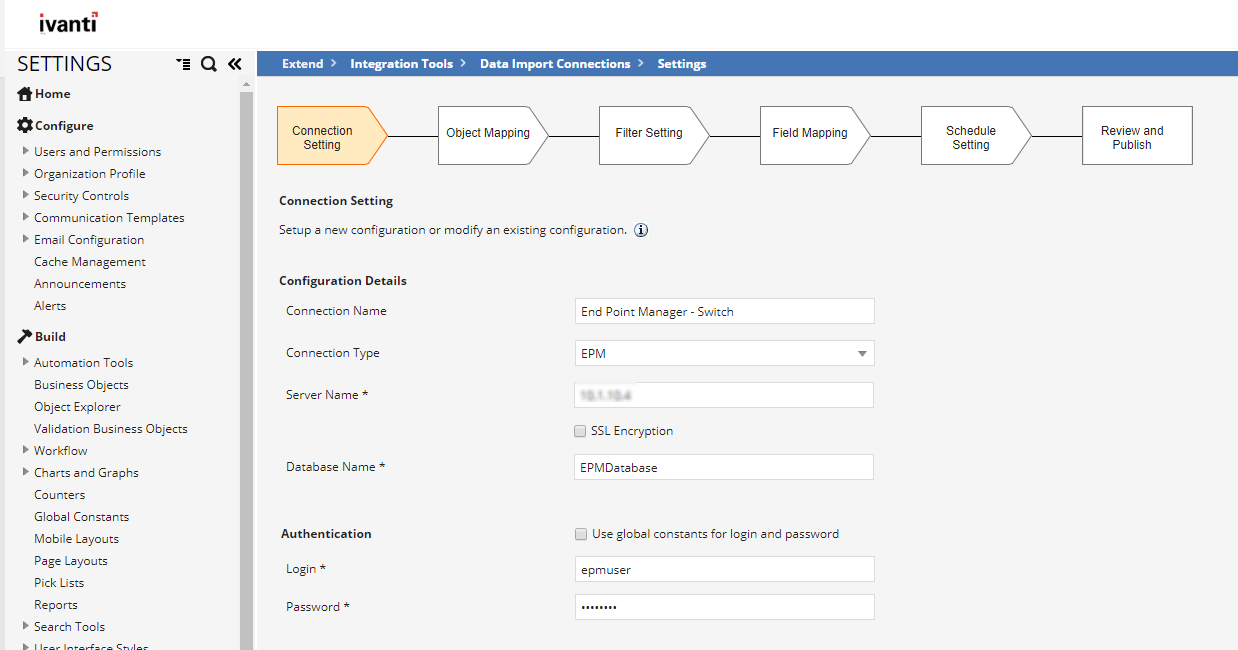
3.Double-click the newly imported package. e.g. Endpoint Manager – Switch.

4.Enter the configuration details for the package. An example, is shown in the below image.
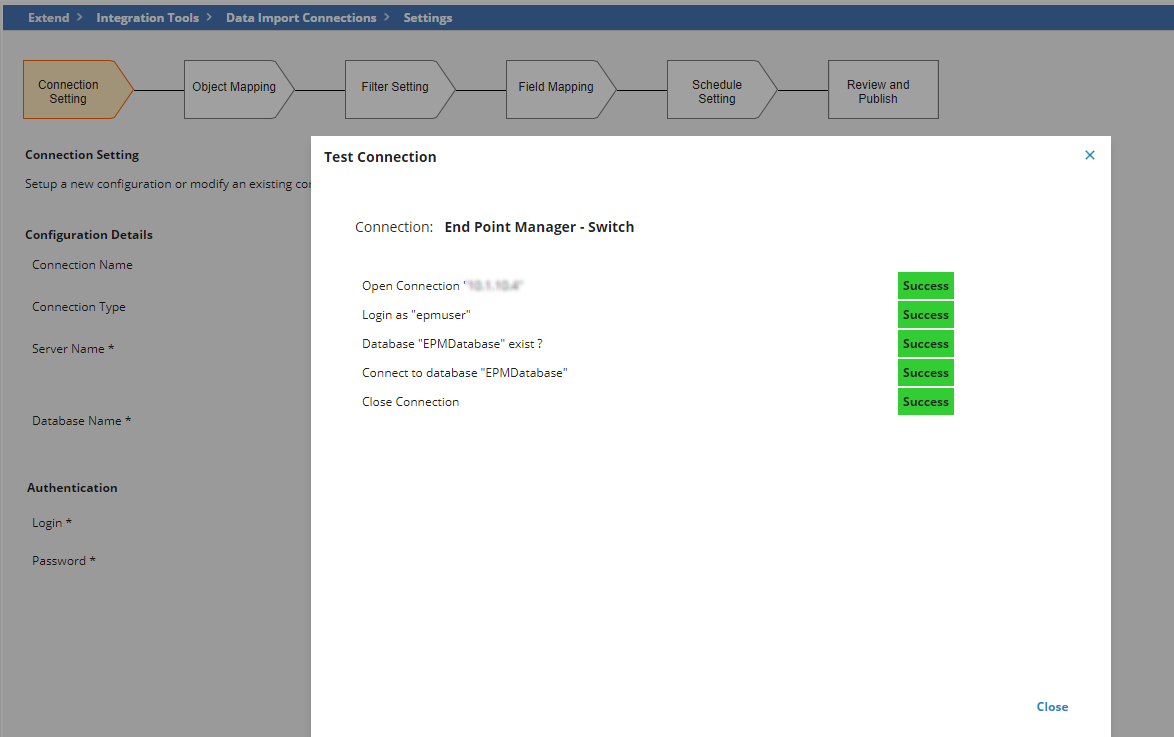
5.Click the Test Connection button to perform a test once the configuration details are entered.
If the test is successful, the following success window is displayed.
6.Click the Next button to proceed to Object Mapping.
By default, the below tables are selected, however, you can customize the mapping.
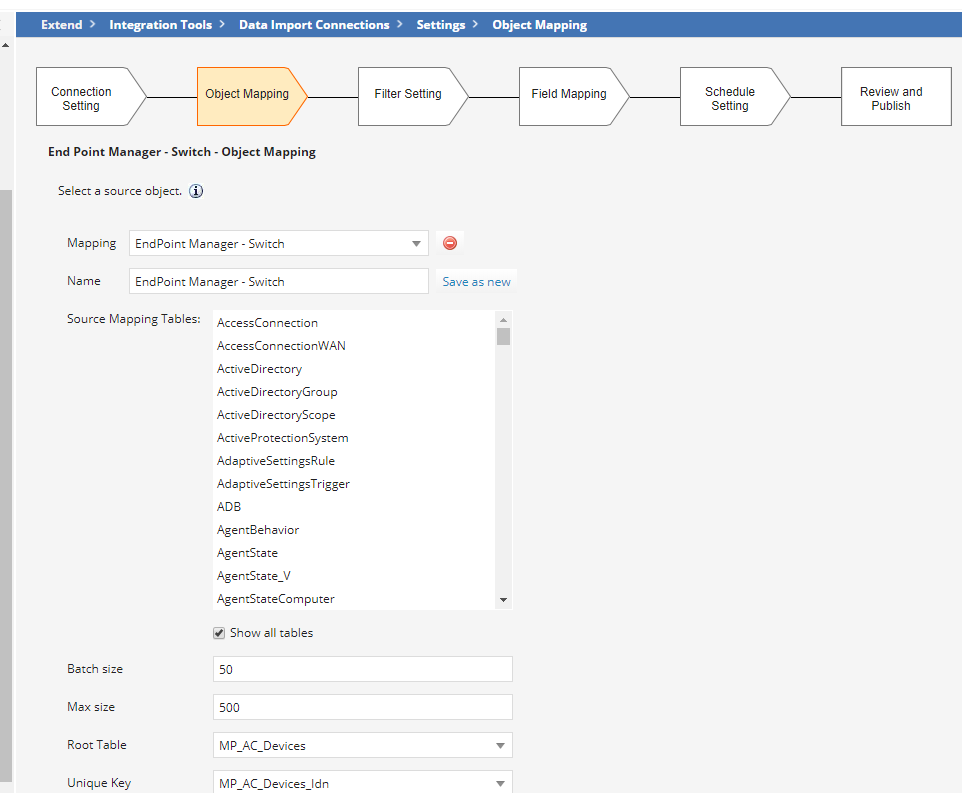
7.Keep the default values and click Next to proceed to Filter Settings.
8.If any specific filter is required, you can add mapping, else proceed to Field Mapping page.
9.Define any filters you need and click Next to proceed to the Field Mapping page.
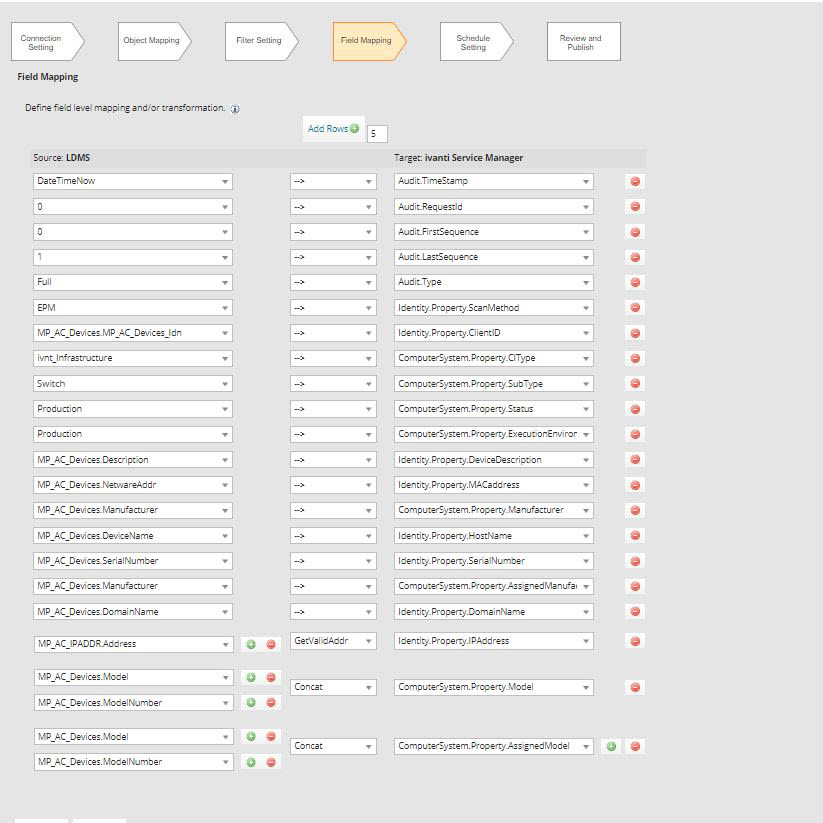
10.Verify the mapping values and click Next.
11.Skip the Schedule Setting step (optional).
12.Click the Preview button before publishing.
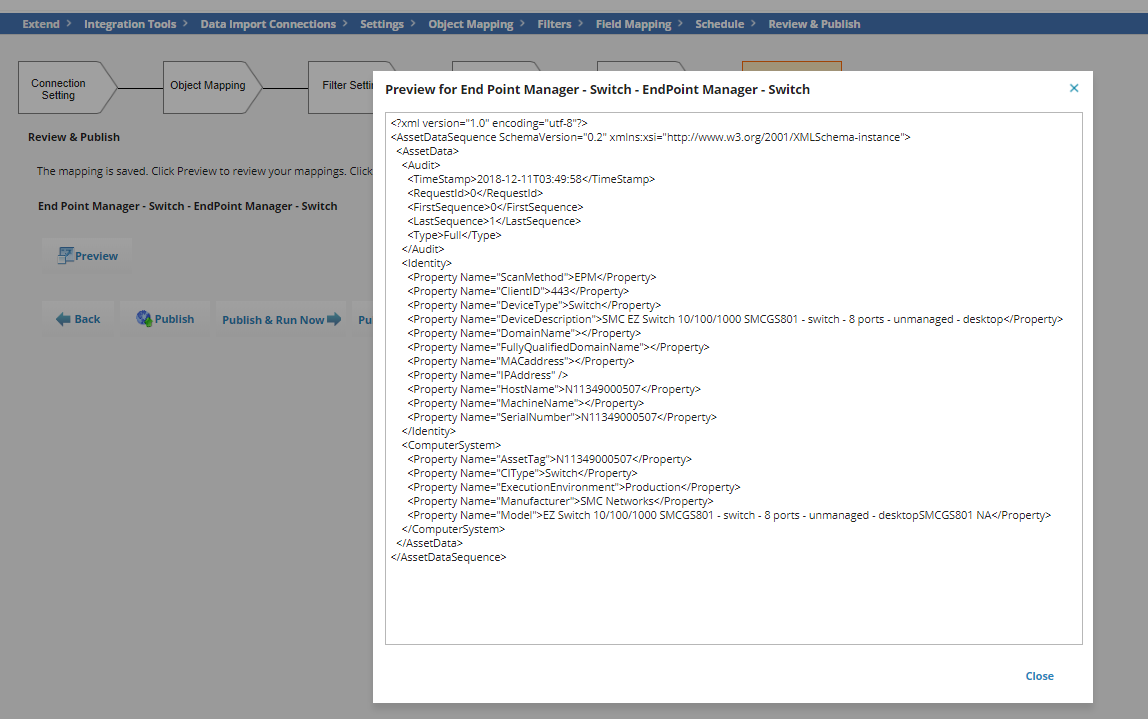
13.Click Publish to complete the Data Import Connection.
If import is successful, the following message is displayed.
Troubleshooting
Data Import - To view if the job is running as scheduled or to view if the job run.
Viewing the Integration Log
The details of the processed job can be viewed in the Integration Log workspace by following the below steps:
1.Log in to the Neurons for ITSM as an Administrator.
2.Open the Integration Log workspace.
3.To open the workspace, click the and select More > Integration Log.
4.From the Integration Log workspace, view the information in the columns for the list of logs or open a record to view details.
The following information is available:
•Log Type - Shows three log types:
•Queued: Indicates that the source ID from Endpoint Manager has been queued in the inventory management asset data processor.
•Verified: Indicates that the source ID from Endpoint Manager has been successfully created in the Ivanti Neurons for ITSM database.
•Stats: Shows the statistics about the number of rows processed.
•Source ID - Endpoint Manager root table key (Computer) shown on the Object Mapping page of the wizard.
•Target ID - Asset ID that is derived from the asset identifier mapping function on the Field Mapping page of the wizard.
•Start Time - Time when the job should run.
•End Time - If applicable, the time by which the job should end.
•Total Processed - Total number of records processed. If there are no new mappings added, there will probably be no records processed.
•Message - Informational message, which varies according to the log type. While the job is being processed, you can view it from the Integration Queue workspace.
Viewing the Integration Queue
While the job is being processed, you can view the record from the Integration Queue workspace.
After the job is processed, the record will not be available from the Integration Queue workspace. You can then view it from the Integration Log workspace.
1.Log in to Neurons for ITSM as an Administrator.
2.Open the Integration Queue.
3.To open the workspace, click the and select More > Integration Queue.
•The workspace will be empty when there are no records to process.
•When the record appears in the Queued Status in the Integration Log workspace, then the record appears while it is being processed in the Integration Queue workspace.